QSDA Pro Charts Deconstruction
QSDA Charts Deconstruction displays the Calculation time for each Qlik chart directly within a Qlik sheet. This functionality assists developers in identifying visualization performance bottlenecks and optimizing chart efficiency.
INFO
Available for Qlik Sense/Cloud (sheets).
TIP
Make sure to have Soterre Helper turned on and configure QSDA Pro connection to see the chart-to-flag connection.
Find 'QSDA Calctime'
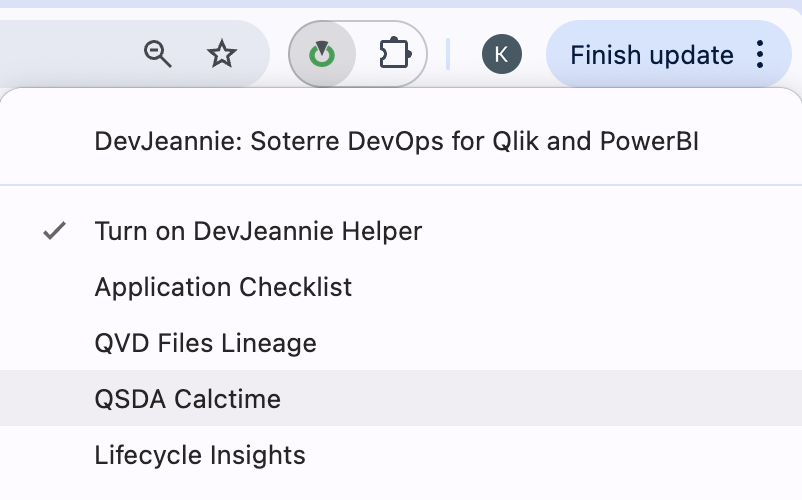
Navigate to the sheet > right-click on the extension icon in your browser to reveal the Soterre DevOps Analytics's context menu. Find QSDA Calctime.
Soterre DevOps Analytics: QSDA Pro Charts Deconstruction
Explore Charts calculation times
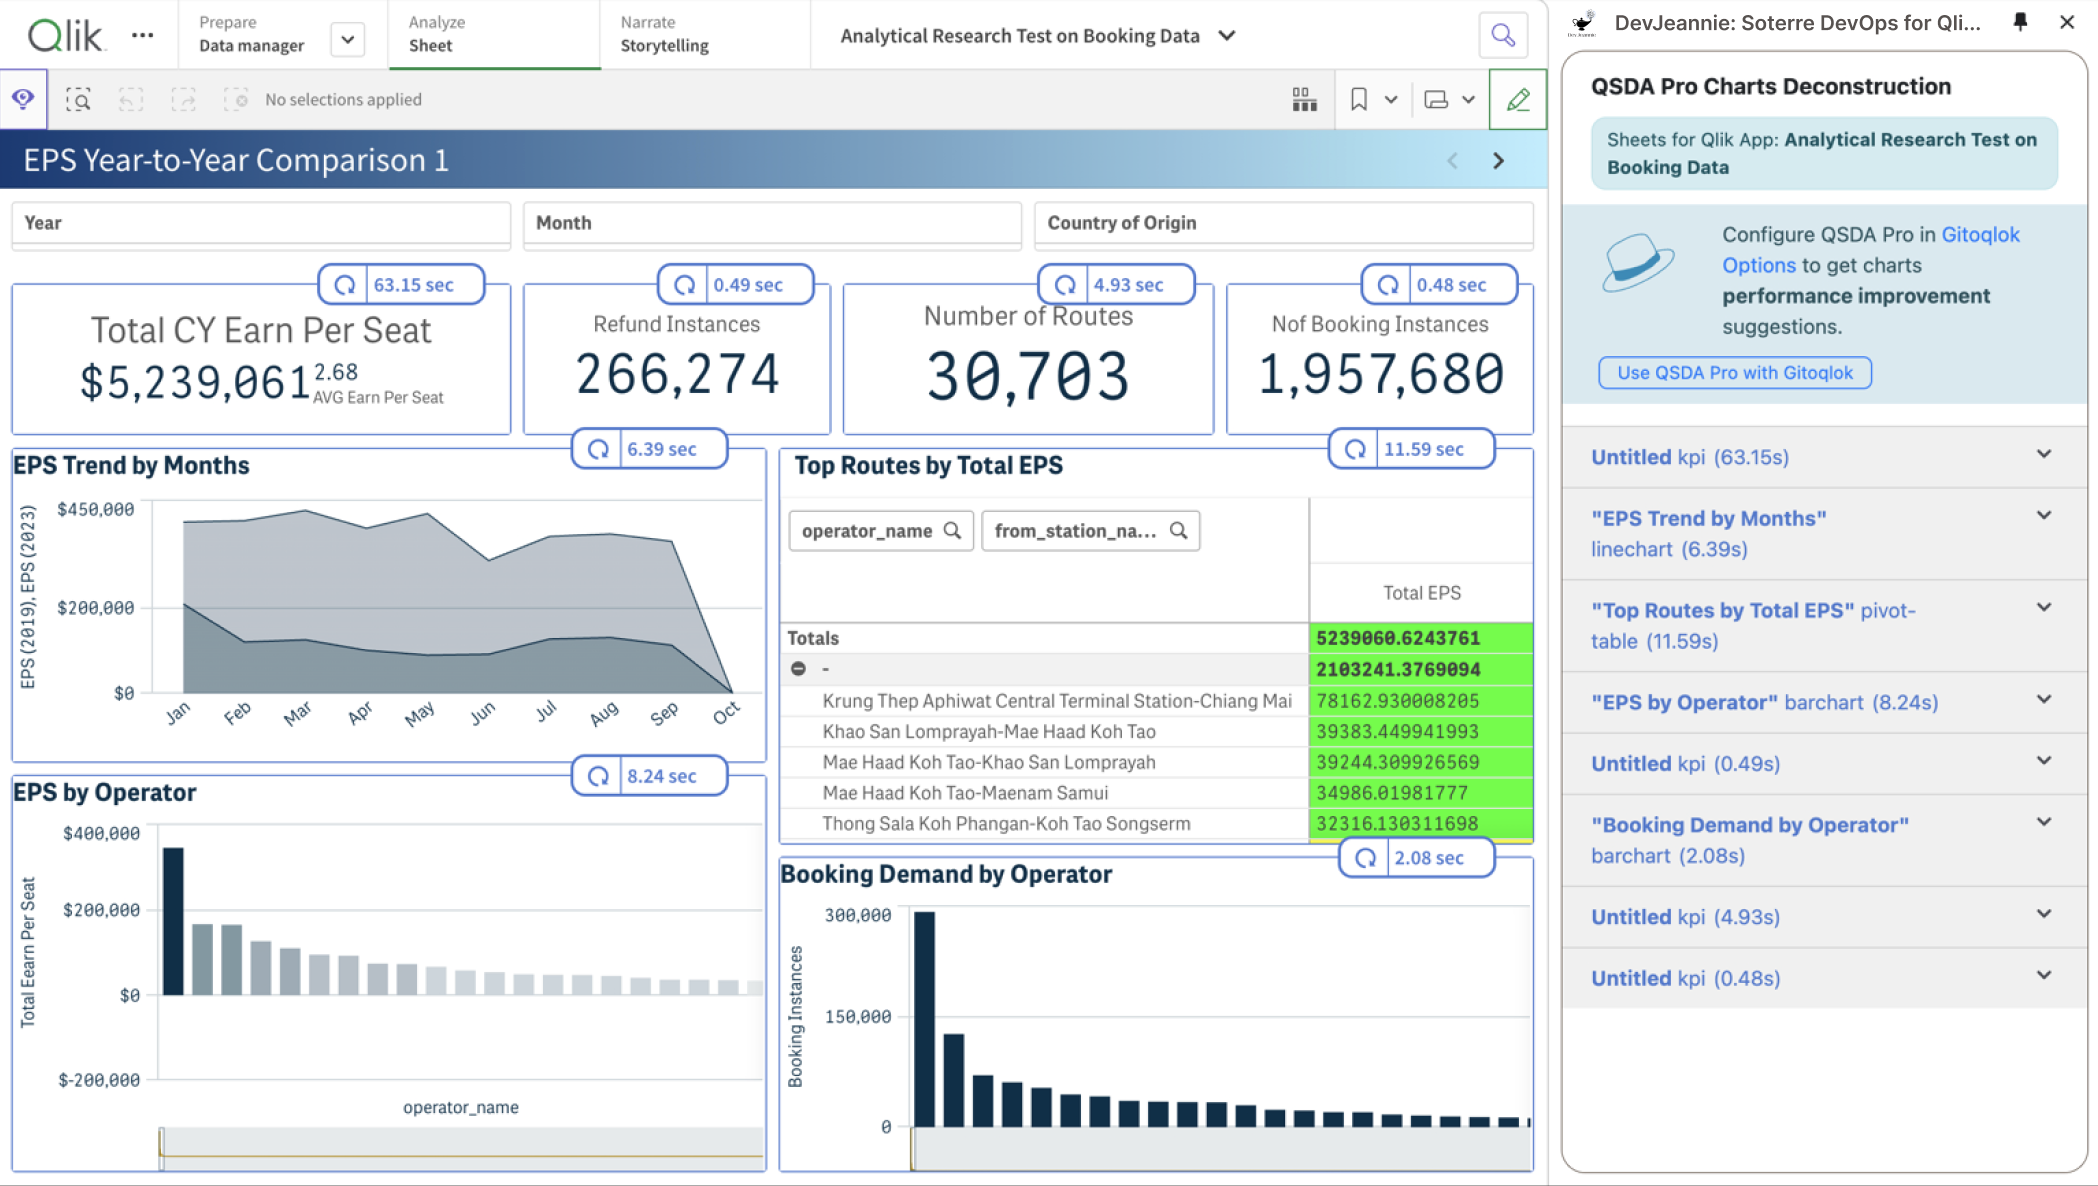
Each chart on a sheet will be augmented with frames and calculation time badges. The Side Panel provides a list of all visualizations on a current sheet with their calculation times.
How does Soterre DevOps Analytics calculate chart performance?
DevJeannie scans the Qlik Sense application to gather metadata about visualizations.
It identifies the dimensions, measures, and expressions used in each visualization. For each chart, DevJeannie measures the time taken to compute its results.
This involves evaluating the complexity of expressions, the use of functions like Aggr(), and the data volume being processed.
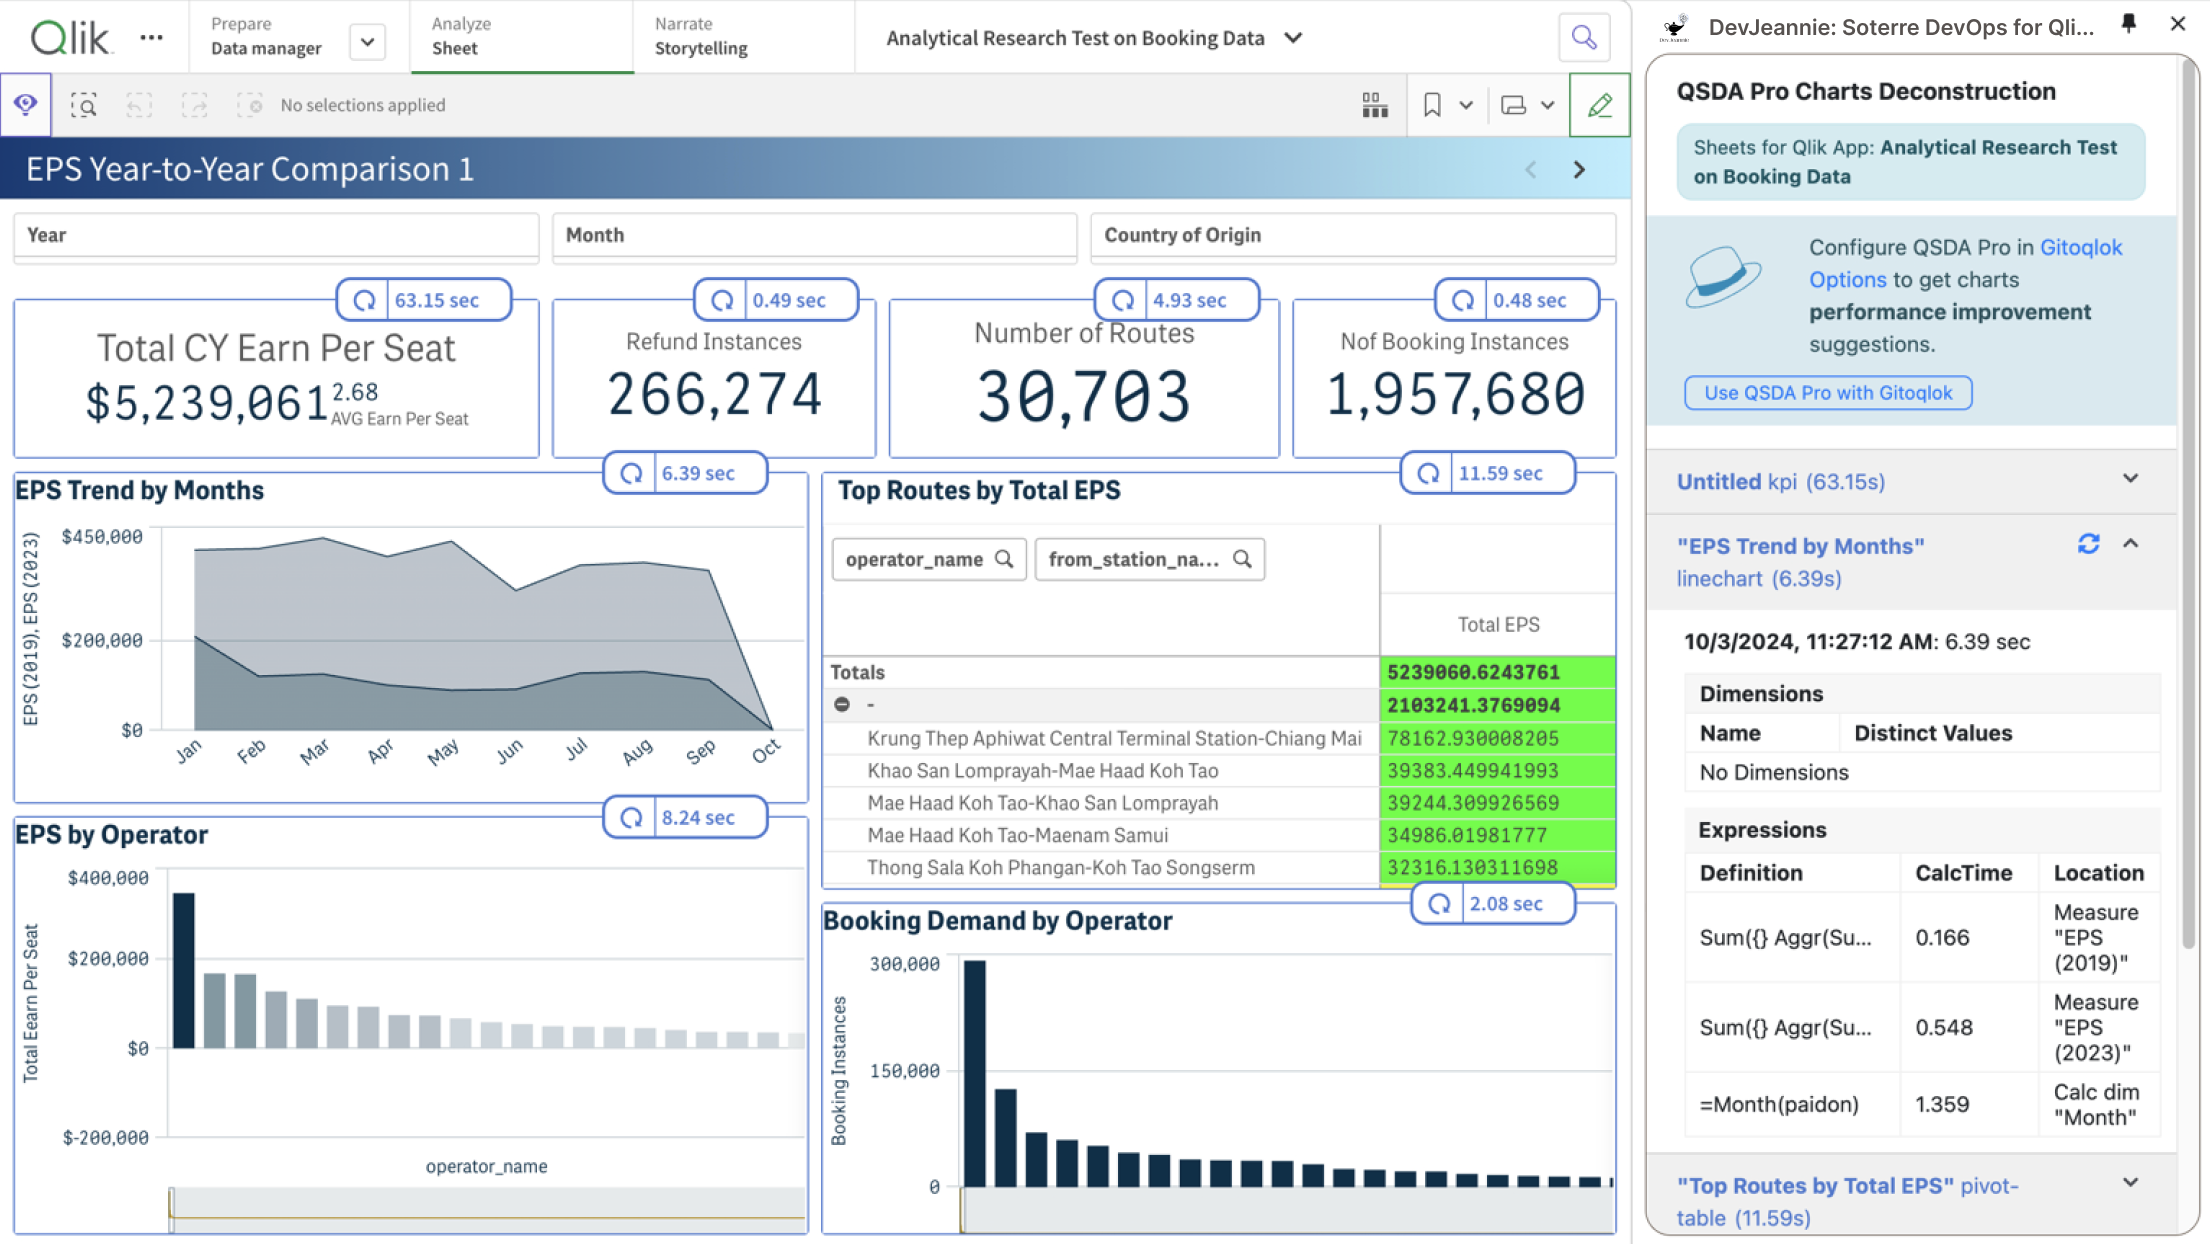
Users can drill down into specific charts to view their components, such as dimensions and measures.
- For dimensions, DevJeannie calculates the number of distinct values. This information helps assess the complexity and potential performance impact of each dimension.
- For each measure, DevJeannie evaluates the expressions used and measures their individual calculation times. This detailed timing allows developers to pinpoint which measures may be contributing to longer overall chart rendering times.
Soterre DevOps Analytics: QSDA Pro Chart Calctimes
Explore the Deconstruction Table
Expand any chart in Side Panel to view the deconstruction table. The Deconstruction table is used to break down chart calculation time by expressions used. This is useful when tuning a long running chart.
Learn more about Charts Deconstruction from QSDA Pro documentation page.
Soterre DevOps Analytics: QSDA Pro Charts Deconstruction Table
Click the refresh button on a chart badge to repeat the calculation. The history of calctimes for this chart will be available in a deconstruction table and saved within the current viewing session. This is useful for tracking the calculation time changes using the new chart settings.
You can repeat the calculation for the chart deconstruction table as well by clicking the refresh button on a chart in Side Panel.
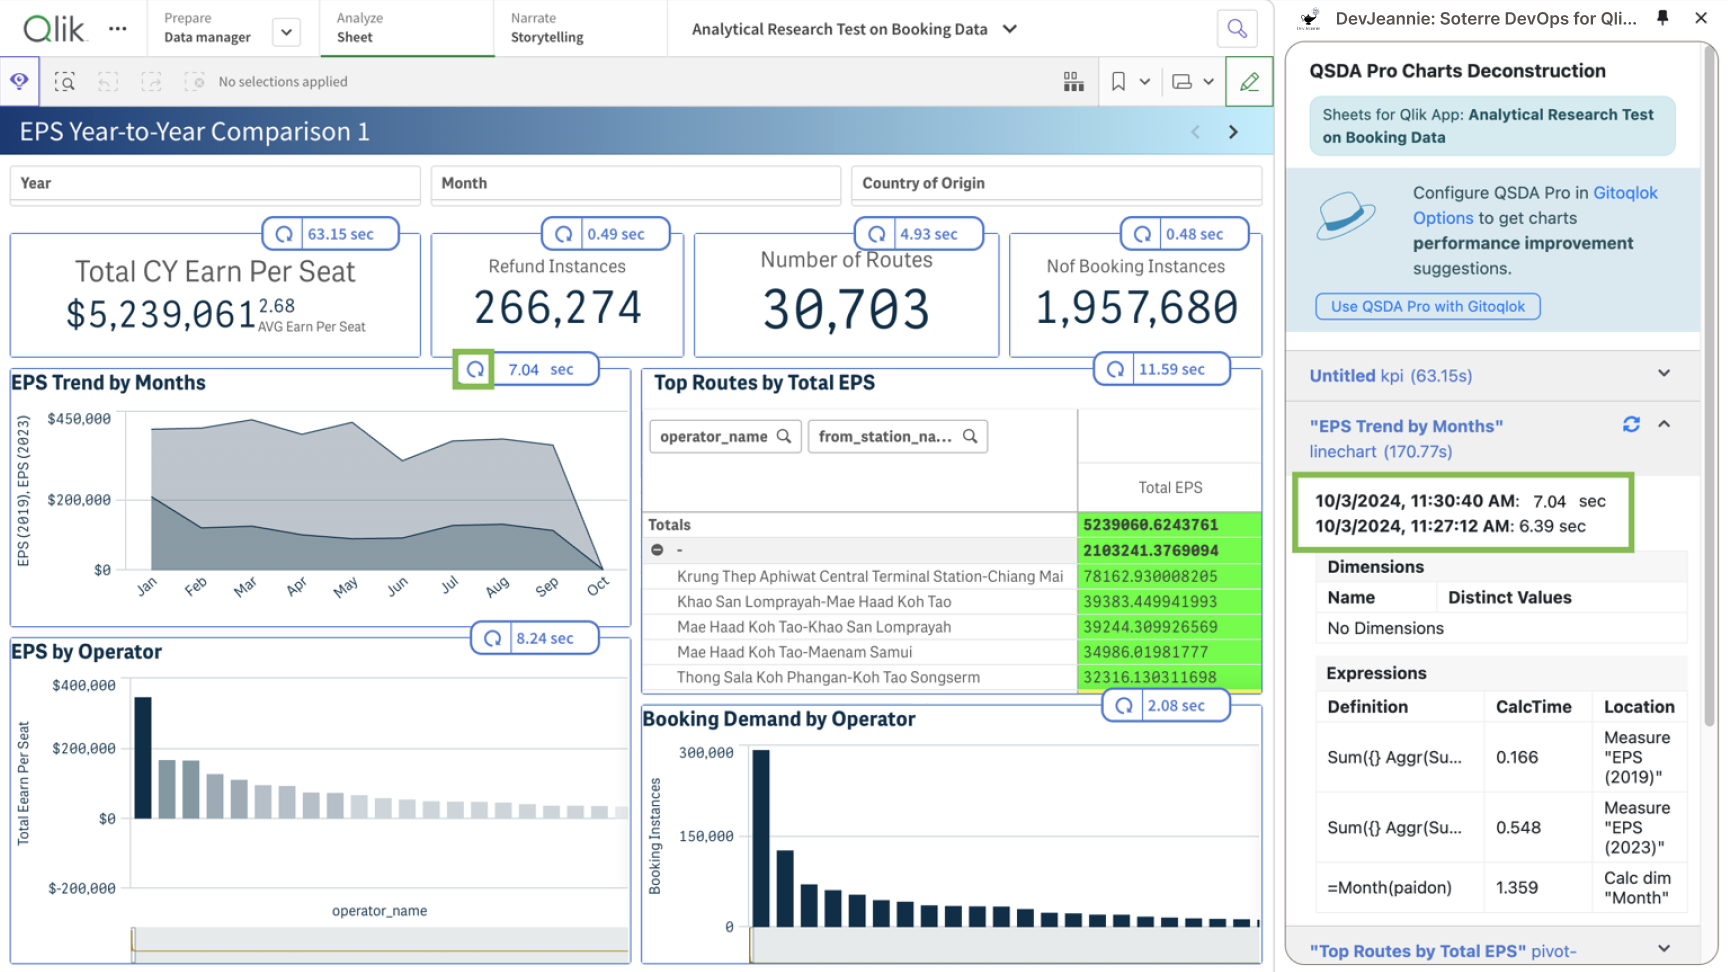
Session history of chart calctimes
Explore Charts Deconstruction with QSDA Pro connection
Orange icon on a chart badge will indicate there is a QSDA Pro flag associated with chart components - either dimensions or measures. Click on the orange icon to view the flag in Side Panel. Hover on the flag icon to reveal the flag definition.
Visit QSDA Pro documentation page to learn more about each flag description.
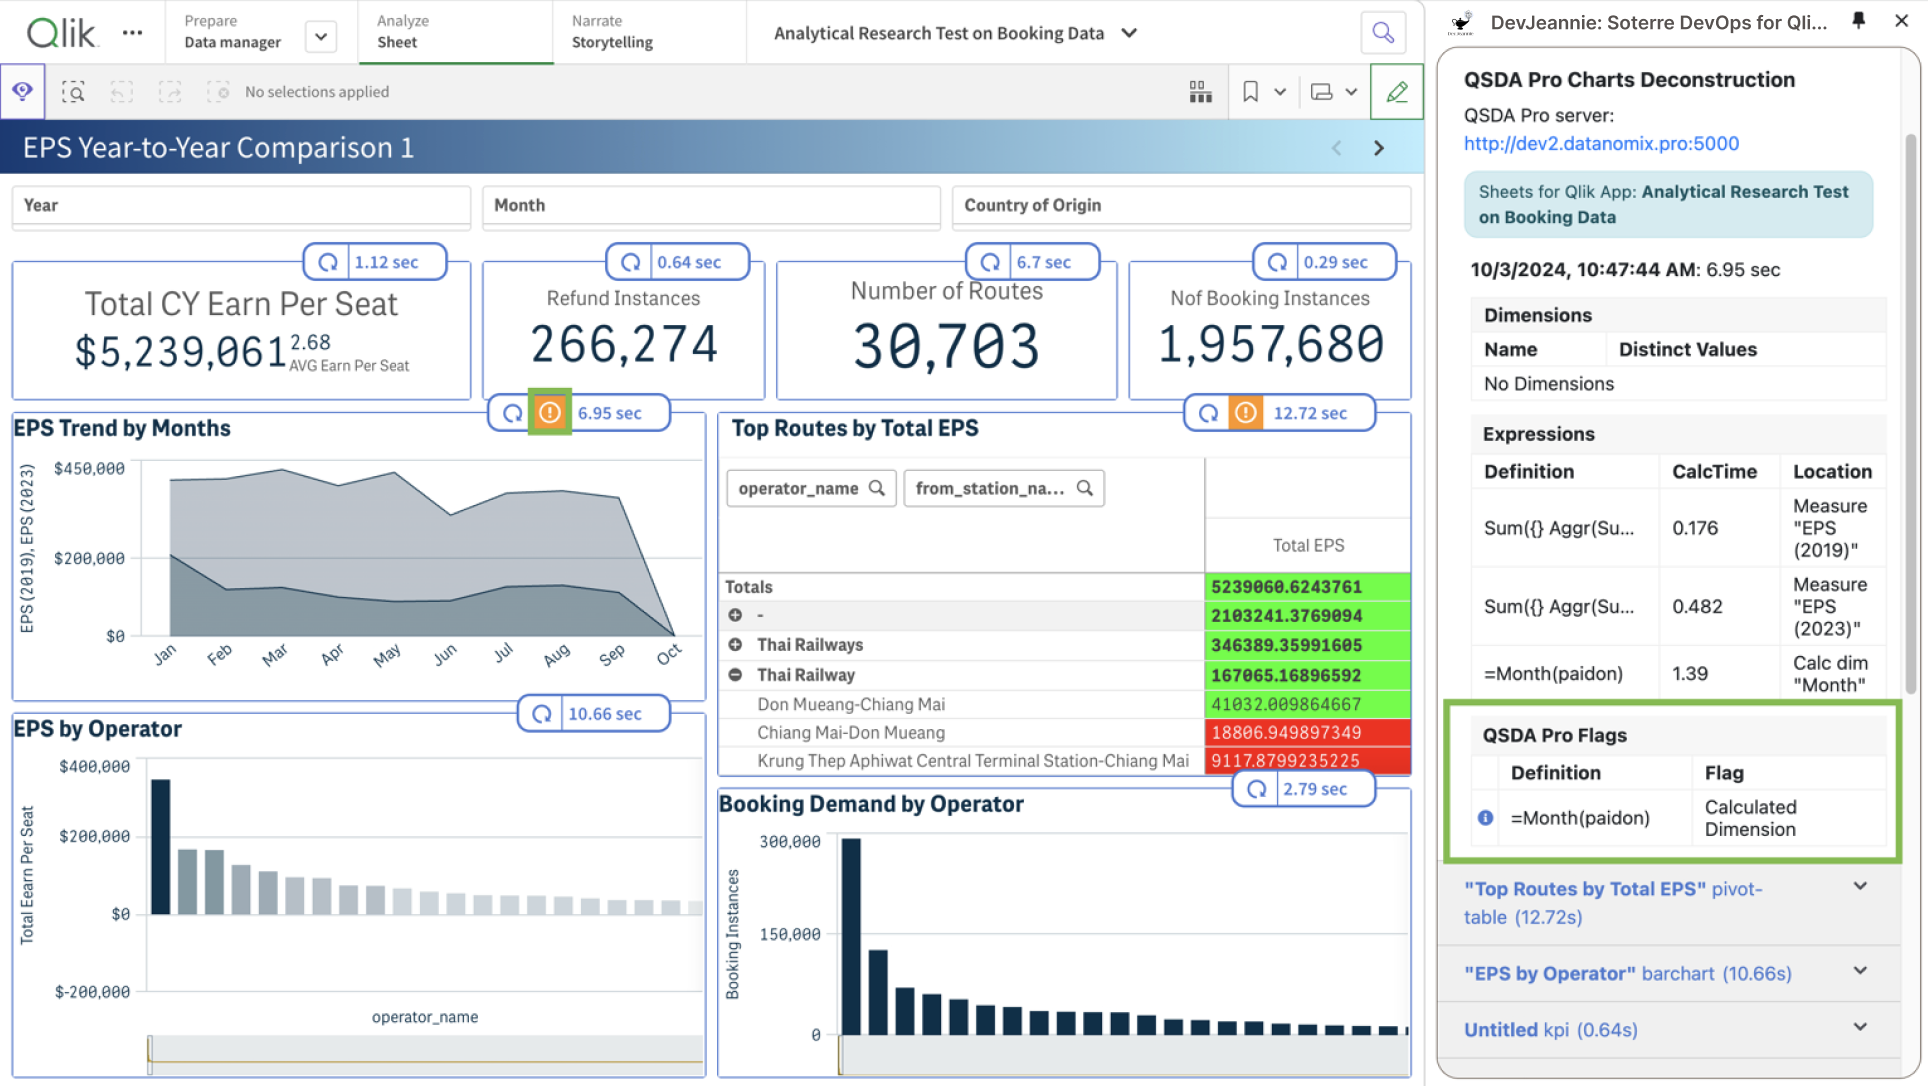
Viewing QSDA Pro flags in chart deconstruction table